Diffusing capacity of the lung (DLCO) has been routinely available in clinical pulmonary function laboratories for nearly 50 years. Originally described by August and Marie Krogh1 in the early 1900s, it has been a mainstay for assessing a subject’s ability to transfer gas across the alveolar-capillary membrane, hence the European reference to the test as the “transfer factor.” In 2005, the American Thoracic Society and European Respiratory Society published for the first time a single consensus guideline from both professional organizations. There also has been a fair amount of literature aimed at the quality of the test results and methods of improving this quality. We will review the highlights in the 2005 ATS-ERS guidelines2 and discuss literature, including quality models, that can make this test even better.
 |
| Figure 1. Syringe DLCO |
Background
Diffusing capacity of the lungs is typically measured using a small concentration of carbon monoxide (CO) gas and is termed DLCO. The process of CO uptake can be simplified into two conductance properties: membrane conductance (DM), which reflects the diffusion properties of the alveolar-capillary membrane, and the reaction of CO and Hb. Diffusing capacity can be affected by factors that change the membrane component, as well as by alterations in Hb and the capillary blood volume. There are several methods of measuring Dlco, including single breath, steady state, intra-breath, and rebreathing techniques. Although the latter two techniques may have specific testing advantages (eg, for individuals with small lung volumes), the single breath technique is the most widely used and accepted method. The ATS-ERS published guidelines are specific to the single breath testing methodology.
2005 ATS-ERS DLCO Highlights
 |
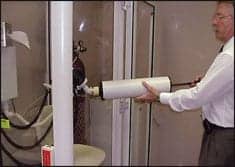
| Figure 2. BioQC with human volunteer. |
In the latest release of recommendations, there are a few changes that might be considered substantially different from the predecessor 1994 ATS guideline. The first couple are directly related to the quality control of the equipment. The guideline recommends weekly “syringe DLCO” measurements. This is performed using a validated 3-liter syringe in the patient testing mode, where the syringe mimics the breathing test characteristics of a subject. If the instrument does not have the capability of turning off the BTPS correction factor, the volume measured should be approximately 3.3 liters with the measured DLCO close to zero (Figure 1), since no gas is transferred within the syringe.
The second recommendation is weekly (or whenever a problem is suspected) testing of standard subjects, also referred to as biological quality control or simply BioQC (Figure 2). These should be healthy laboratory or volunteer subjects who are readily available. A minimum of 20 data points should be obtained as soon as possible to establish statistically relevant data (Figure 3). This data can be recorded in an Excel spreadsheet to calculate the mean and standard deviation for the subject. The ATS-ERS guideline recommends a variation of <10% until the laboratory or subject establishes their own criteria of variability, which should be less than 6%. In our lab, we use standard Levey Jennings plots and Westgard rules3 to define critical action points. There is a commercially available software package that does the statistical analysis called EzyQC,4 which is available on the Web for those who do not want to or do not have the computer skills to build their own spreadsheets. Regardless of the tool used to review the BioQC data, if an error is identified, the first action taken is to repeat the test or have a second BioQC subject test themselves. If the repeat test confirms the outlier, the DLCO system should be evaluated carefully for the possibility of leaks, nonlinear analyzer function, or volume and time inaccuracy. The standard also notes that an alternative to a BioQC subject is a DLCO simulator, which uses two validated syringes in conjunction with primary standard-grade gases to simulate various volumes and exhaled gas concentrations that would be measured from a human subject. It is fast becoming the gold standard for validating and verifying the accuracy of an instrument, with the only drawback being the initial cost of the system. One solution to reduce the initial cost is to buy a system to share among institutions in a given city or health care system.
 |
| Figure 3. Results of BioQC – DLCO |
In the testing technique section of the guideline, the most significant change was the reduction in measured inspiratory vital capacity (IVC) from 90% to 85% of the largest vital capacity (VC). The ATS-ERS statement notes that this recommendation is based on a paper by Johnson,5 which demonstrated that it takes a 15% reduction in IVC to cause a 5% reduction in DLCO. When I reviewed the paper, I noted that the statement used IVC/VC of 90% as a quality indicator and only reported that it took up to a 24% reduction in VA to yield a 10% reduction in DLCO. Regardless, the new recommendation is still 85% of the largest measured VC. The final major change was broadening the breath-hold time to 8 to 12 seconds from the previously recommended 9 to 11 seconds.
An acceptable test maneuver includes all of the following2:
- equipment that has calibrated and passed quality control criteria;
- an inspiratory volume that is at least 85% of the largest measured vital capacity and occurs within 4 seconds;
- a breath-hold time 8-12 seconds without evidence of leaks or Valsalva or Muller maneuvers;
- expiration <4 seconds (collection time <3 seconds) with appropriate clearance of dead space.
What Is the Test Quality Evidence?
In 1991 Wanger and Irvin6 reported the results of a study during which they measured common pulmonary function parameters in 13 pulmonary function laboratories in a metropolitan area using five biological control subjects. They found statistically significant variability in DLCO with a coefficient of variation (CV) that ranged from 11.5 to 18.6. Hopefully, these dismal results are not the same in laboratories today. In a more recent study7 that assessed the performance of five commercial PFT instruments using 11 healthy volunteers in a very controlled environment, the CV ranged from 4.93 to 9.83 over a 24-week period, depending on the instrument used in the testing. In an abstract at the 2007 American Thoracic Society meeting, Enright et al8 reported data from a preclinical trial survey sent to 73 United States-based pulmonary function laboratories, where half were performing monthly BioQC, yet only 12% of these labs were performing it weekly as recommended by the ATS-ERS guideline, and only 31% incorporated a syringe DLCO into their quality control program. Wise and colleagues9 reported data from a multicenter clinical trial using a very well-defined standardization process that included uniform instrumentation, centrally trained study coordinators, and centralized data monitoring with feedback to the testing site. In this very controlled study, they reported a total of 4,797 test sessions (95.5%) producing at least two acceptable DLCO efforts that could be used to determine the reported average. Of these, 3,607 test sessions (75.2%) and 4,581 test sessions (95.5%), respectively, were reproducible to within 1 and 2 mL/min/mm Hg. They also reported a DLCO coefficient of variation of 6.01%. The data from this last study appears to provide evidence that if one follows a rigorous quality assurance program, the reproducibility of the measurement can even be better than the recommended ATS-ERS criterion.
 |
| Table. “DLCO Path of Workflow” |
What Else Can We Do?
In the Clinical Laboratory and Standards Institute’s A Quality Management System Model for Health Care,10 the “path of workflow” is described as the operational aspects that define how a particular service is provided. In this path of workflow model, one identifies all phases of the service across the entire spectrum of that service, which would include pretest, test, and posttest processes in our laboratories. The Table lists some of the variables that should be considered along the path of workflow that can affect the quality of the outcome in measuring DLCO. As we reviewed the highlights for the ATS-ERS guideline, we have not mentioned many of the variables listed; however, it certainly does not degrade their importance in the quality of the test outcome. A pretest instruction list presented at the time the appointment is scheduled can alleviate many issues when the subject arrives for testing. Evaluating and adjusting for communication barriers and test expectations can assist in a positive test session outcome. Finally, considering posttest processes such as reference author selection, interpretation review, and turnaround time will improve the quality of the service we provide. The ATS conducted a survey of laboratories in their registry in 2005.11 The average turnaround time for pulmonary function test results to reach the medical record was <1 day (15%), 1 to 2 days (30%), 3 to 4 days (27%), 5 to 6 days (15%), and >7 d (3%). Undoubtedly, a turnaround time of greater than 2 days in more than 50% of the laboratories participating in the survey affects the quality of the service they are providing to the clinicians. (Total ≠ 100: -ed.)
Summary
Diffusing capacity is gaining more and more importance in the evaluation of the alveolar-capillary membrane interface. The development of new medications that use the respiratory system as a delivery route and the clinical trials associated with those drugs, along with mandatory longitudinal follow-up with certain therapeutic interventions (eg, amiodarone, inhaled insulin, etc) and the lung and cardiovascular abnormalities that affect gas exchange, all require that the test provided is of the highest possible quality and with the lowest variability. Identifying and alleviating barriers to compliance with the ATS-ERS recommendations is essential. Compliance with these recommendations still does not remove all obstacles to a quality product, however. We need to review all processes across the path of workflow in order to provide the best data and service to our patients and clinicians.
Carl D. Mottram, RRT, RPFT, FAARC, is director, Mayo Clinic pulmonary function laboratories and pulmonary rehabilitation; and associate professor of medicine, Mayo Clinic College of Medicine, Rochester, Minn.
References
- Krogh A, Krogh M. Rate of diffusion into lungs of man. Skand Arch Physiol. 1910;23:236–47.
- McIntyre N, Crapo RO, Viegi G, et al. Standardization of the single-breath determination of carbon monoxide uptake in the lung. Eur Respir J. 2005;26:720–35
- Tools, Technology and Training for Healthcare Laboratories. Available at: www.westgard.com. Accessed April 3, 2009.
- EzyQC. Available at: www.ezyqc.co.nz/index.html. Accessed April 3, 2009.
- Johnson DC. Importance of adjusting carbon monoxide diffusing capacity (DLCO) and carbon monoxide transfer coefficient (KCO) for alveolar volume. Respir Med. 2000;94:28–37.
- Wanger J, Irvin C. Comparability of pulmonary function results from 13 laboratories in a metropolitan area. Respir Care. 1991;36:1375–82.
- Jensen RL, Teeter JG, England RD, White HJ, Pickering EH, Crapo RO. Instrument accuracy and reproducibility in measurements of pulmonary function. Chest. 2007;132:388–95.
- Enright P, Blonshine S, Harris R. Suboptimal quality assurance (QA) programs in PFT labs, Poster G17. Presented at: American Thoracic Society International Conference; May 22, 2007; San Francisco.
- Wise RA, Teeter JG, Jensen RL, et al. Standardization of the single-breath diffusing capacity in a multicenter clinical trial. Chest. 2007;132:1191-7.
- A Quality Management System Model for Health Care. HS1-A2. Wayne, Pa: Clinical and Laboratory Standards Institute.
- Davies J, Crapo R, MacIntyre NR. Pulmonary function testing interpretation and report generation is a slow, cumbersome and inefficient process. Presented at: AARC 51st International Congress; December 3-6, 2005; San Antonio.


